Figure 3.1: What is low cost?
If the Wright brothers were alive today Wilbur
would have to fire Orville to reduce costs.
(Herb Kelleher)
When it comes to explaining and analyzing the fundamentals of the low cost airline business model, we are inevitably faced with a major stumbling block, which is the large number of myths and preconceived ideas surrounding it. It must be recognized that this is partly due to the popularity that this model has achieved: around 40% of airline seats in Europe are flown by airlines that follow this model with varying degrees of adherence, with that share even exceeding 50% in some countries such as Spain or Italy, amongst others. And, although one might expect that this would mean a deeper understanding of the low cost business model, this is not the case and, what is more, even the media have contributed to the creation of certain urban myths, which do not correspond entirely to reality.
This is so for a number of reasons; the first is due to the relatively recent phenomenon of cheap fares, especially in Europe, where, as we have seen in the previous chapter, until the end of the 1990s flying was extremely expensive, only accessible to a minority of privileged people. And in some markets, the boom of cheap fares is even more recent, having begun less than ten years ago. Therefore, it is natural that there is a certain initial mistrust, and consumers ask themselves the following question: “... but let’s see, how can it be that a flight costs less than the taxi from the airport to the destination city? There’s got to be something wrong here...” These suspicions are usually assuaged in most cases as soon as consumers try the product, but in any case they pave the way for stereotypes and clichés as soon as the slightest opportunity arises.
Secondly, the “low cost airline” label, far from defining a single homogeneous model, contains many different ways of achieving its primary objective, which is to offer low fares to consumers. But in many cases this heterogeneity is not easily identifiable by them, and there is always the risk that they observe the sometimes controversial practices of the most fundamentalist operators, and extrapolate them to any airline with this label, committing an error of assessment. In this chapter we will study the characteristics of the business model that we are going to define as “pure”, in spite of the fact that it is likely that there is not a single company left that follows it one hundred percent, as each one has been adapting its strategy, and deviating to a greater or lesser extent from it. In fact, as we will see in Chapter 5, the trend, at least in the short and medium haul, is towards a hybrid model, since not only have low cost airlines been forced to sacrifice some characteristics of the “pure” model, but also traditional airlines have had to reinvent themselves in order to remain competitive, adopting some of them, something that until recently was unimaginable.
Finally, even the name can be misleading because, by referring to low costs in defining the model, we can run the risk of identifying the focus on costs as the cornerstone of the model, when it is only one of its fundamental pillars. As we will see throughout this book, operational efficiency is a necessary condition for success, since it enables the existence of cheap fares, but it is not sufficient if it is not accompanied by a comparable commercial excellence, which makes it possible to generate the necessary revenue to obtain a sustained profit. In fact, shortly we will be able to see how, in addition to the cost advantages that the model undoubtedly generates, there is a series of revenue advantages that, in many cases, become even more important than the former in terms of the keys to the success of the model. On the other hand, the search for a cost structure as efficient as possible is not exclusive to this model, as we will see below.
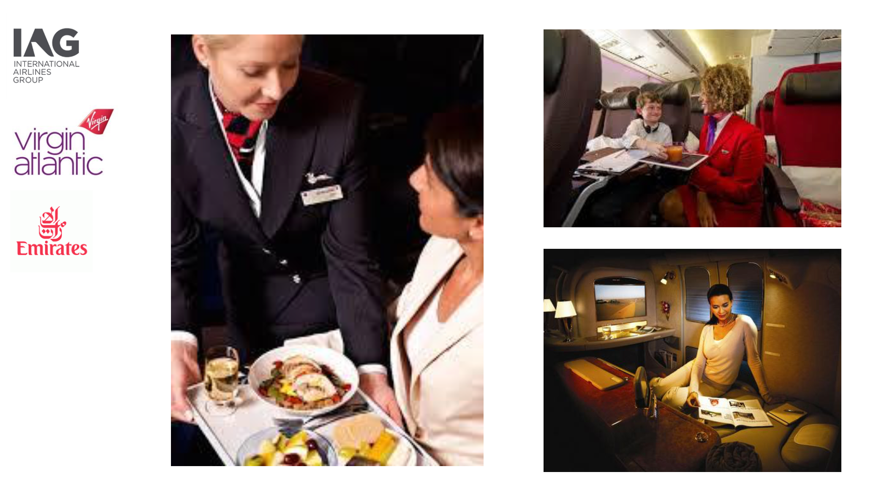
In order to try to explain the importance of having the lowest possible costs and, especially, the different ways this can be delivered, regardless of the business model, this author usually uses an analysis carried out in 2014 by the CAPA Centre for Aviation, which compares the unit costs of three traditional airlines (the term used in the study is legacy carriers) such as Emirates, Virgin Atlantic and IAG – the latter being considered the combination of British Airways and Iberia for these purposes.
But first, readers are invited to look at Figure 3.1, which shows three photos of the service on board each of the airlines mentioned, and to try to identify each of them with its corresponding picture. Subsequently, they are asked to mentally classify them from the highest to the lowest unit cost.
Figure 3.1: What is low cost?
After having carried out this exercise many times with different groups of students, this author has invariably found that the identification test has a success level of almost 100% and, except for a few absent-minded people, all correctly recognize each photo with its corresponding airline. The interesting thing begins when you start to answer the second question about unit costs: here too there is a majority response in favour of Emirates allegedly having the highest unit cost, with somewhat more disparity of opinion about how the other two compare. This assumption is normal, given that Emirates is often identified as an airline with an excellent and luxurious service and, consequently, it follows that this can only be achieved at higher costs – the photo used with one of its suites on board an Airbus A380 reinforces that perception, and hence its choice (a bit opportunistic, no question) to achieve the desired effect.
The surprise appears when it is unveiled, following the referred CAPA study, that reality is completely the opposite of what is perceived: as can be seen in Figure 3.2 (CAPA, 2014), Emirates is the one with unit costs, measured in US dollar cents per available ton-kilometer (ATK), lower than either of the other two airlines.
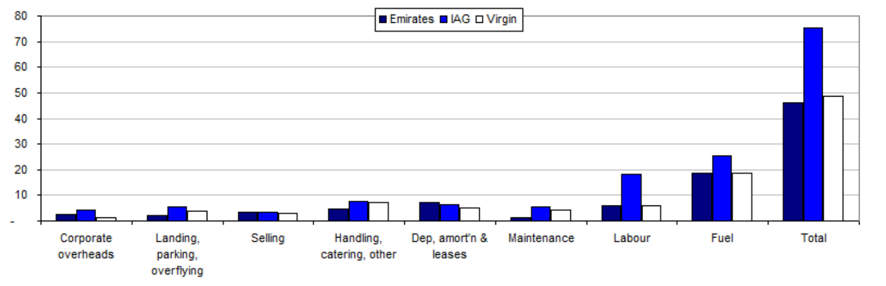
Figure 3.2: unit cost in US$c per ATK - Emirates vs IAG vs Virgin Atlantic (CAPA, 2014)
In fact, due to the correlation between unit costs and average stage length (flight duration) which, as we will see later in this chapter, causes the former to decrease as the latter increases, the comparison shown may be misleading, since Virgin Atlantic’s average stage length is considerably larger than that of the Emirates, and this is bigger to that of IAG. Therefore, in order to ensure that we are comparing apples with apples, it is necessary to standardize the data by adjusting them according to the stage length, as otherwise erroneous conclusions could be inferred from the analysis, assuming as relative cost advantages what would be no more than a consequence of a different network design. In the study cited, they took advantage of the fact that the average stage length of the combination of IAG plus Virgin Atlantic is very similar to that of the Emirates, reaching the comparison shown in Figure 3.3 (CAPA, 2014) of the unit costs of the latter compared to the average of the other two.
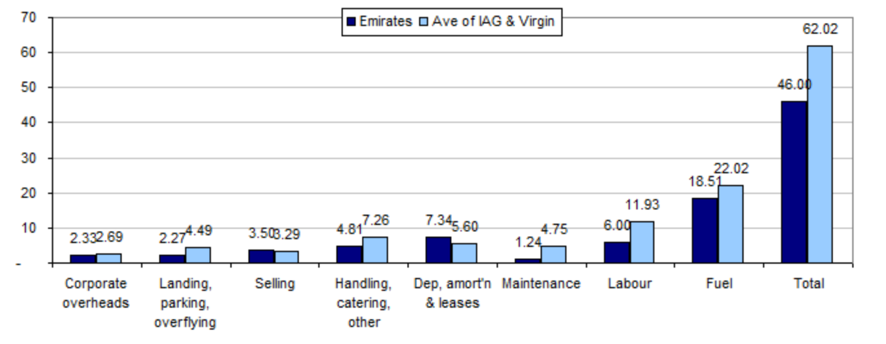
Figure 3.3: unit cost in US$c per ATK - Emirates vs average of IAG + Virgin Atlantic (CAPA, 2014)
We observe then that the unit cost of Emirates is about 26% lower than the average of IAG and Virgin Atlantic, which is somewhat, at least, counter-intuitive, as shown by the number of students who continually say the exact opposite. When trying to explain the reasons for this, the conversation immediately comes to the alleged subsidies that the former would receive, in the form of advantages in airport charges at its Dubai hub, as well as lower labour costs due to the absence of income tax or trade unions. What should be noted, however, is that the CAPA study makes an adjustment to both items and determines that, even normalizing its effect, the Emirates unit cost advantage is still greater than 20%, which shows that there must be another explanation for this enigma.
And the explanation is none other than the operational efficiency of its business model, based on the geostrategic location of its hub which, unlike other network airlines that need a short-haul, narrow-body fleet to feed it, allows Emirates to do it exclusively with wide-body aircraft, driving a much lower unit cost. Indeed, in contrast to the short/long haul model of most of its competitors, which requires smaller aircraft for its effective feeding, the Emirates model could be classified as long/long haul, thus being much more efficient. Returning to the comparison of the study, this implicit circumstance in the business model means that the number of seats offered per movement by Emirates is 27% higher than the average for IAG and Virgin Atlantic, and this manifests itself in a unit cost advantage manifested in almost all cost lines.
In short, we have seen how a luxurious proposition can be made compatible with the operational efficiency necessary to have a low unit cost structure, which shows that the latter is not an exclusive feature of low cost airlines. In fact, in an industry as competitive as commercial aviation, the search for as low a cost structure as possible is a given in any airline seeking to achieve sustained profitability, regardless of the business model. Therefore, answering the question titled in this section, low cost is not only a label that defines a particular model, but is a necessary condition of survival, although, as we will see throughout the book, not sufficient. The key to success is knowing how to combine a cost structure that is as competitive as possible, within the strategic direction chosen in each case. For example, the cost advantage that Emirates enjoys because of its larger average aircraft size would be of no use if they were then unable to sell a large share of that additional seating capacity at an appropriate price, meaning the cost advantage would be diluted by not obtaining the revenue. In fact, fortunately for this airline, it manages to carry around 40% more passengers per day than the average of IAG and Virgin Atlantic, which is proof of the robust nature of its strategy.
Once we have understood the paramount importance of making sure that having as competitive a cost structure as possible is aligned with the chosen revenue model, we come to the point of explaining how one is intimately related to the other. In fact, balancing revenue and cost is without a doubt the big headache of any airline executive. And to understand this I’m afraid we have no choice but to dust off some of the old math books.
Starting from the premise that the objective of any for-profit company is to maximize its profit, and this is equal to the difference between revenue and expenses, in Figure 3.4 we see how each of the components of the formula are usually broken down in this industry.
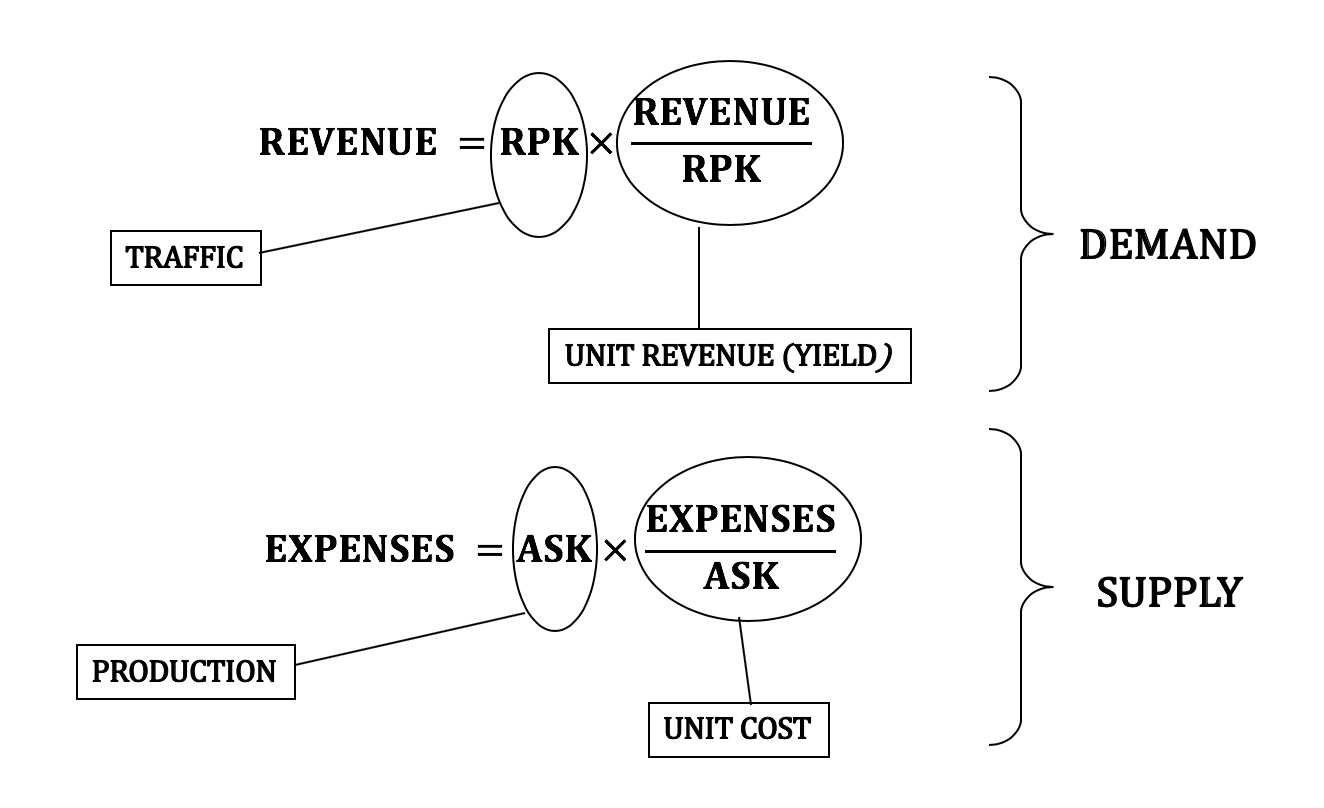
Figure 3.4: Components of the profit formula
On the demand side, we see that revenue is obtained as the product of traffic, measured in revenue passenger-kilometers (RPK), by unit revenue or yield, which is nothing more than the result of dividing revenue by RPK. The use of RPK to measure traffic is due to the fact that, if we only used the number of passengers transported, we would be adding very heterogeneous elements, since a passenger who flies, for example, 1,000 kilometers, is not the same thing as another passenger who flies 7,000 kilometers, and hence the fact that the distance flown is usually used as weighting factor to homogenize the result. This circumstance, which is especially important for airlines flying both short and long-haul, is less critical for those only flying short and medium-haul, as is the case with most low cost airlines, and hence it is quite frequent in the latter to simply use passenger numbers as a measure of traffic, rather than RPK, as we shall see later.
On the supply side, the expenses result from the multiplication of the volume of production, measured in available seat-kilometers (ASK), by the unit cost, which is the expenses divided by the ASK. The level of production, also known as offered capacity, is an essential element, since, of the four parameters into which we have seen the profit formula is broken down, it is the only one that the airline’s management team has the possibility of setting at the level they deem appropriate. Indeed, we can verify that there are two “volume” elements (traffic and production), and two “price” elements (yield and unit cost), where there is a greater or lesser control by the airline over three of them, through different levers, but, unlike the capacity, its value cannot be fixed a priori. Hence, decisions about capacity, both medium and long-term, are amongst the most important ones any airline’s management team faces.
For the time being, even the least versed reader in mathematical knowledge will agree that the level of sophistication has been minimal, as we have limited ourselves to multiply and divide income by RPK, and expenses by ASK. We will go one step further, proceeding to divide all the elements of the benefit formula by ASK, as shown in Figure 3.5, in order to obtain the unit profit or profit by ASK.
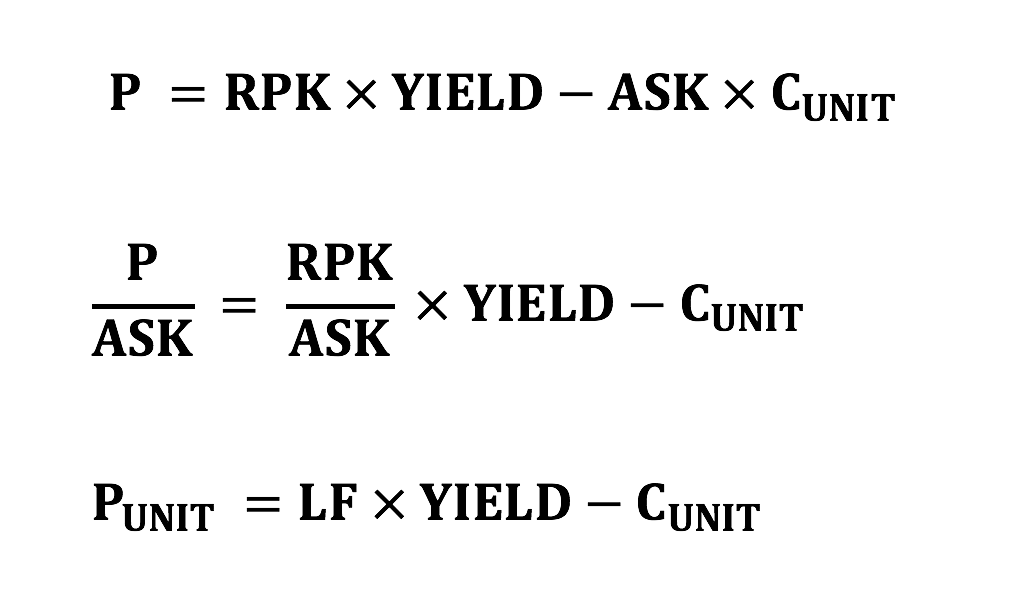
Figure 3.5: unit profit formula
We then see that the unit profit, or profit obtained per ASK, is equal to the difference between the product of load factor and the yield, minus the unit cost. In this way, once capacity has been established, profit maximization depends on maximizing the first two parameters (LF, YIELD) and minimizing the third (CUNIT). The problem arises when it is ascertained that, far from being independent of each other, they are related between them, usually in an inverse way. Thus, the relationship between the first two is well known: the lower the fares and, consequently, the yield, the greater the demand and, with it, load factor, and vice versa. Also, if an airline decides to make an improvement in cabin configuration, or to increase the number of crew on board to provide a better service, so as to be able to increase unit revenue by attracting customers who are willing to pay a bit more for it, these measures will invariably lead to an increase in unit cost. Finally, costs also increase with load factor, because certain costs, such as airport charges, have a component that is paid per embarked passenger, hence, the higher the load factor, the higher the cost.
Having reached this point, a reassuring message for any reader who is not mathematically minded, having seen the formula obtained in Figure 3.5 no more complicated computations are required to be able to understand the rest of the chapter and the book. Indeed, the unit profit formula helps to understand the fundamentals of the low cost business model, based on obtaining the lowest possible unit cost – we will soon see how –, which allows the existence of very low fares. This in turn helps to generate additional demand that leads to nearly full aircraft. The key is to make sure that the combination of the two favourable factors (high LF/low CUNIT) compensates the unfavourable (low YIELD), so that a positive unit profit is achieved. This unit profit, however small, is multiplied by a very large production volume, becoming a significant amount that characterizes the successful examples of companies that follow this model.
Using this formula, we can also understand the differences between this business model and the one followed by traditional or network airlines, successors to those formerly known as “flag carriers”, which we have summarized in Table 3.6.
|
LOW COST MODEL |
NETWORK CARRIER MODEL |
LF |
HIGH |
MEDIUM |
YIELD |
LOW |
HIGH |
CUNIT |
LOW |
HIGH |
Table 3.6: comparison between the low cost and the network carriers model
In this table we can see that, while the low cost model has two of the three factors in its favour, the network carrier model has only one, which is yield. This fact gives us some indication about what is behind the differences in profitability between the two models seen in Chapter 1. Of course this is a generalization that simplifies what is actually a very heterogeneous set of companies and approaches, so it is important to understand it as such. In fact, we started this chapter by talking about a network carrier, such as Emirates, that diverges from this categorization. What’s more, the case of Emirates can be defined as paradigmatic, having all three factors in its favour, which is an exception and explains to a large extent the reasons for its sustained profitability over the years.
Returning to the low cost business model, and having understood that one of its fundamental pillars is to achieve the lowest possible unit cost, it would now be time to begin to understand how this is done. But to do so it is necessary to first understand the main characteristics that determine an airline cost structure, which is precisely what we will see in the next section.
When it comes to breaking down and categorizing airline costs, we find that there is a diversity of criteria used, depending on the purpose for which the exercise is carried out, the accounting practices of the country where the head office is located, as well as other considerations. Despite this, there is a standard classification and consequent structure created by ICAO, under which all member airlines are obliged to report their financial data on an annual basis. The main consequence of this is that, except for small discrepancies of criteria in the classification of certain items, there is considerable uniformity in the cost structure used, largely following what is prescribed by ICAO. Given that it is thought to cover any type of airline, independently of the business model, we will make some minimal modifications, so that it properly adapts to the structure used by the low cost model, main subject of this book.
First, costs are broken down into non-operating and operating costs. Non-operating costs are mainly the result of financial transactions, such as interest payments, losses on dealings with assets or subsidiary companies, or losses linked to foreign currency transactions, amongst others. Due to the fact that all these transactions are very much company-specific, non-operating costs are usually of little use when comparing one airline with another, and even to analyze the evolution of the same airline over time, given the ad hoc nature of many of them.
This is not the case for operating costs, which relate to the main activity carried out by airlines, which is the transport of passengers and/or cargo from one location to another. Operating costs are usually further subdivided into two:
• Direct operating costs (DOC): its most common definition is that they are those operating costs dependent on the type of aircraft in the fleet and how it is operated.
• Indirect operating costs (IOC): contrary to the above, operating costs which are independent of the composition and use of the fleet.
So far we are basically following a functional classification, something that will become more obvious once we break down each of the two categories into its corresponding components, but to complete the analysis we would have to include a time dimension, depending on the degree of variability of the different costs in the short term. According to this new subdivision, the costs would be classified between fixed and variable costs:
• Fixed costs: those that do not vary in the short term with the level of activity.
• Variable costs: those that vary with the level of activity in the short term, measured in block hours, number of sectors or other indicator.
Although a priori in the ICAO standard classification both direct and indirect operating costs may have a fixed and a variable component, the norm for low cost airlines is that indirect costs have a minimal variable element, so in order to simplify the structure we will assume that only direct operating costs have it. As for this variable component, its relevance is due to the fact that it provides the degree of “avoidability” of the different items: by this we mean that variable costs are those that can be avoided by reducing the level of activity; for example, when cancelling a flight, you save the cost of fuel, airport and navigation charges, or flight crew per diems, amongst others.
After this introduction, we show in Figure 3.7 the cost structure most commonly used by low cost airlines, including the most relevant items in each of the categories, which we will briefly define in order to better understand the main determinants of costs. In order to be able to give an order of magnitude of what each of them represents in an airline, we will use the example of easyJet, which in its Capital Markets Day held in September 2017 gave details of its cost breakdown for the year 2016 (easyJet, 2017).
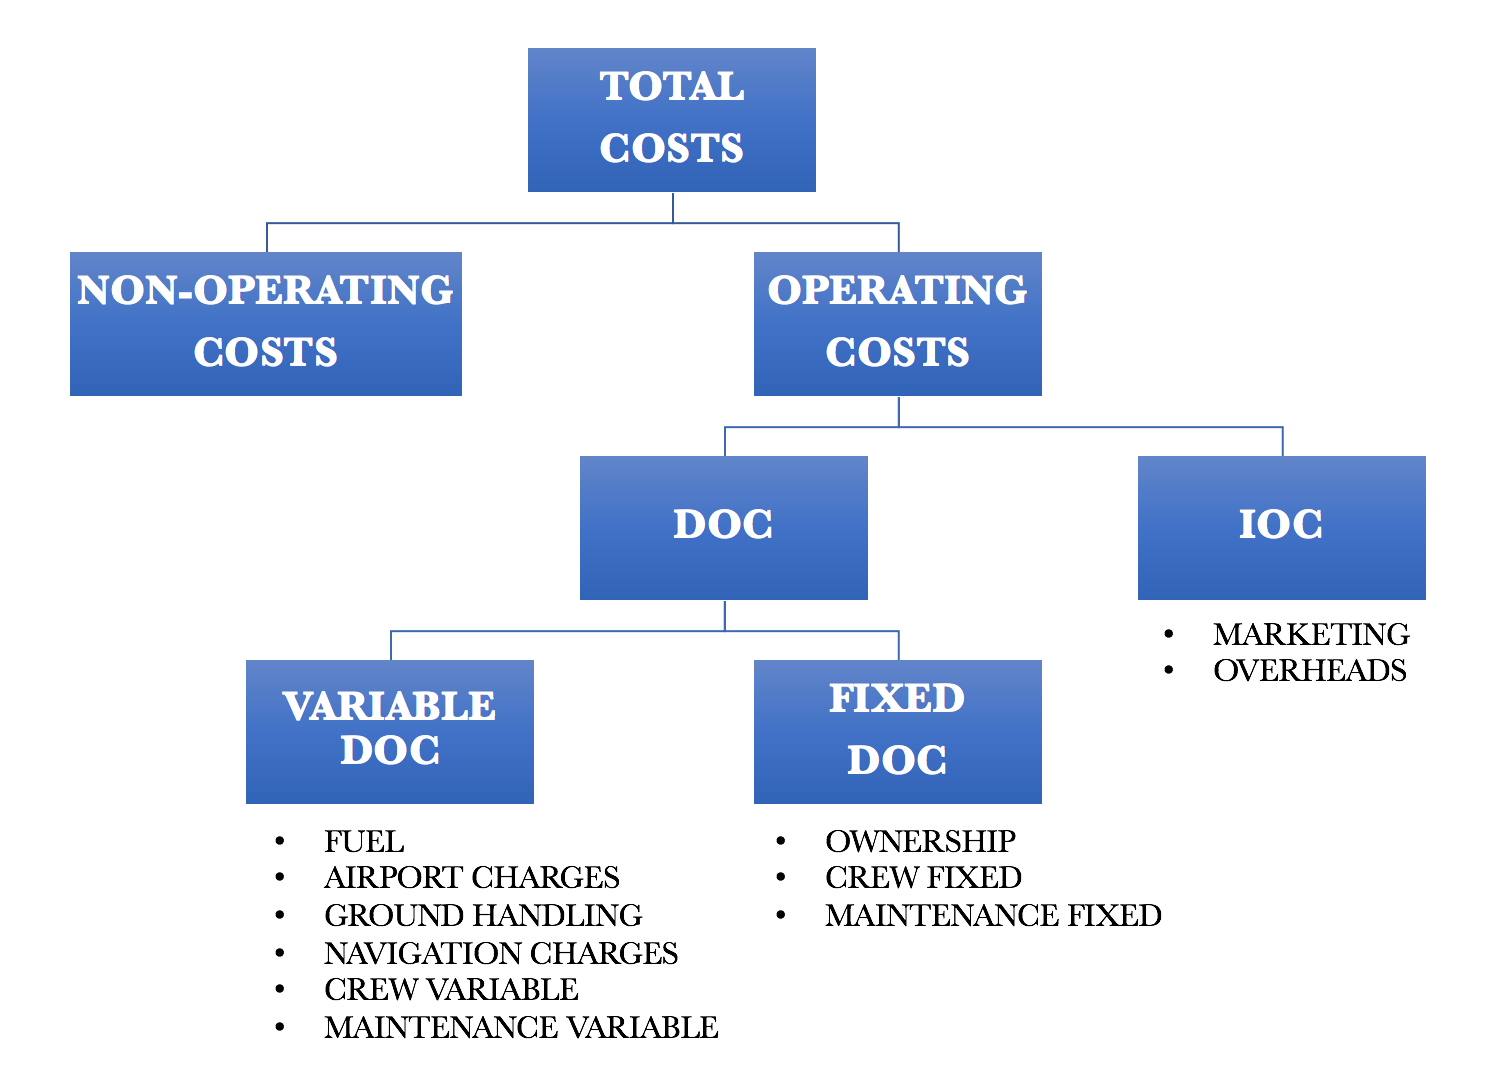
Figure 3.7: generic cost structure of a low cost airline
• FUEL: typically the main cost component of any airline, although its weight in the total depends very much on the evolution of oil price. The number of block hours is the main driver of fuel cost, although average stage length also plays a role, as we will see shortly. In the case of easyJet, fuel represented about 27% of its total cost in 2016.
• AIRPORT CHARGES: these are the fees paid to airport operators for the use both aircraft and passengers make of the facilities and services. They usually have a component that is paid for each departing passenger, and another that depends on the number of movements and the size of the aircraft. In the case of Europe, Directive 2009/12/EC of March 11th, 2009 regulates their application in airports with more than five million passengers, as well as those with the most traffic in each Member State. This circumstance reduces significantly the airlines ability to negotiate or even influence their evolution. Although easyJet does not break down this component separately (it is included under the heading together with ground handling), both jointly accounted for 30% of its total cost in 2016. Moreover, from information published in the past, it can be assessed that more than three quarters of this figure corresponds to airport charges alone.
• GROUND HANDLING: it is the cost of providing both assistance to passengers at terminals for check-in and boarding, and to aircraft during each arrival and departure turnaround. Most ground handling processes are very labour-intensive, so the staff is the main component, although for most low cost airlines this represent a variable element, as they usually subcontract this service to third parties. The number of movements and, to a certain extent, the size of the aircraft, are its main drivers.
• NAVIGATION CHARGES: these are the fees paid to air navigation service providers for the provision of the navigation services, both en-route and during the approach and take-off phases. In the case of Europe, although there are some exceptions – such as the 12 control towers that at the time of writing are operated by private providers in Spain –, the vast majority of terminal area services, and all en-route services, are operated under monopoly, usually government-owned, providers, provoking the influence from airlines in the setting of these charges to be minimal. The distance flown through each airspace, as well as the size of the aircraft, are its main drivers, with this cost representing 8% of the total in the case of easyJet.
• CREW VARIABLE: both flight and cabin crews receive part of their compensation in the form of flight duty allowances, which usually depend on the number of sectors flown, as well as their distance. In most countries there is a favourable tax system for these allowances, configuring the most appropriate structure in each case. In addition, in the case of low cost airlines it is common for cabin crews to receive certain commissions relating to in-flight sales, and also a variable bonus depending on the achievement of certain performance targets, the latter being also applicable to flight crew. This item represents about 2% of total cost in the easyJet example.
• MAINTENANCE VARIABLE: it is the part of the total cost of maintenance of the aircraft and their engines that depends either on the number of take-off and landing cycles, such as landing gear checks, or on the number of hours flown, as is the case of the rest of checks of fuselage, engines or systems, amongst many others, and in the case of easyJet this component carries a weight of 2% on total cost.
• OWNERSHIP: includes aircraft depreciation charges, as well as interest on the debt issued for their acquisition, in the event that this has not been done in cash, something that at least the large low cost airlines can afford to do frequently, given the strength of their balance sheet. Where aircraft are leased rather than owned, the monthly charges for these leases would also be included under this heading. 6% of the total cost of easyJet is included here. One comment is needed here about the “avoidability” of costs referred to above: although this cost is categorized as fixed, which might suggest its inevitability, the fact is that, while not immediately, in the medium and long term aircraft can be sold, or returned to lessors, and thus avoiding or reducing their costs. It is for this reason that the temporal reference is paramount here, meaning that in order to categorize any cost as fixed or variable attention should be paid to the short term only, since in the medium or long term ultimately all costs could be considered as variable.
• CREW FIXED: it consists of the salaries and social charges of the crew, which remain fixed regardless of the volume of activity, at least in the short term. They also include training costs. Its weight in the total cost depends very much on the business model and the structure of the labour model – in the case of easyJet it represents 11% of the total –, and the size and composition of the fleet are its main drivers.
• MAINTENANCE FIXED: both in the case of in-house maintenance or third-party subcontracting, it is the part of the maintenance cost not directly related to the level of activity, but it is again determined by the size and composition of the fleet. Returning to the easyJet example, these costs constitute 4% of the total.
• MARKETING: including the costs of promotion, advertising, website and other sales channels development, as well as incentives to travel agencies, in case the airline in question makes use of such distribution channels as part of its commercial policy. They also include customer service costs, such as telephone assistance and managing disruption, including any passenger compensation. Since the adoption of Regulation (EC) No 261/2004 of February 11th, 2004, which establishes common rules on compensation and assistance to passengers in the event of incidents, including the obligation to fully inform passengers of their rights, and with the subsequent boom in claim management companies, this is an item that has experienced a significant increase in the costs of airlines flying in Europe. easyJet’s marketing costs are around 3% of its total cost.
• OVERHEADS: this last item is made up of headquarters expenses, management and administration staff, information systems costs, as well as any other fixed expenses not included in any of the above categories, and in the case of easyJet they represent 7% of the total.
In Figure 3.8 we can see a summary of the cost structure of easyJet in 2016, where it can be seen that about 70% of these are variable, a figure that varies from airline to airline, and above all between the different business models, with the variable component generally being greater in low cost versus network carriers.
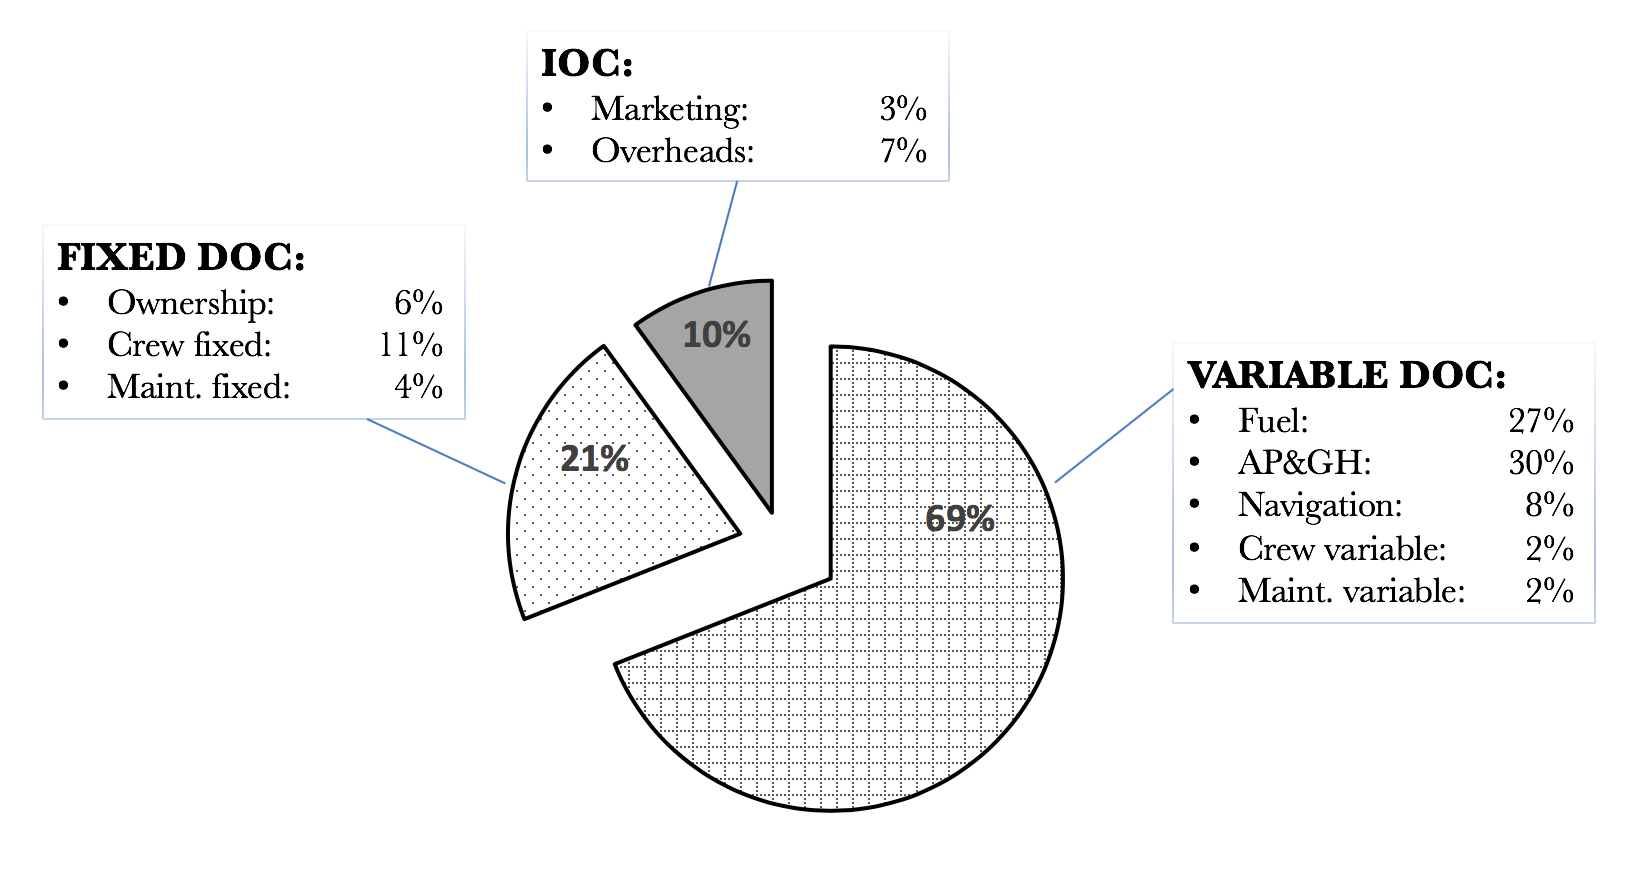
Figure 3.8: easyJet cost structure in 2016
If we add this analysis to what has been explained in the first chapter, within Porter’s model, about the bargaining power of suppliers, we can sympathize – though not necessarily share – with the long-standing complaint of many airline executives about the limited influence they have historically had over a large part of their costs. Indeed, in items such as fuel, airport and navigation charges, or even ground handling, the unit price to be paid for them has largely been an input over which the management team has virtually had very little leverage. Faced with this circumstance, within a non-liberalized – thus absent of competition – environment, the usual reaction was to adopt rather an attitude of resignation: since nothing can be done about it, there is no choice other than offering very high fares to cover all those costs. The consequence, already explained, was making air transport only accessible to a privileged minority. An alternative approach, certainly facilitated by liberalization, was to refuse to accept this economic determinism, looking for new ways to reduce the unit prices of those basic inputs. But, above all, acting on a critical lever that is the efficiency and productivity of resources, as we will see in the next section. But before doing that we must analyze two elements over which airline executives have enough influence, and that do have a significant impact on unit cost, which are aircraft size and average stage length.
Firstly, the larger the aircraft, the lower the unit cost per ASK. This is so because for a large part of the operational costs, although they increase with the size of the aircraft – usually defined by its maximum take-off weight (MTOW) –, they do it on a less than proportional way, resulting in a decrease in the cost per ASK. This is the case with navigation charges, for example, because of the formula which is typically used. This is also the case for ground handling, crew and maintenance costs, which does not increase proportionally with MTOW. In addition, the increase in available seating capacity due to a larger aircraft size is often greater than the corresponding increase in MTOW, which positively impacts almost every line of cost. This size effect is key to the operational efficiency of Emirates as mentioned at the beginning of this chapter.
Secondly, the average stage length is also a determining factor, since, for a given aircraft, the longer the sector length the lower the cost per ASK will be. The main reason for this is that aircraft are only productive when they are in the air, and within the different phases of flight the most efficient by far is at cruising altitude, as not only the speed is higher, but fuel consumption is lower. Therefore, the longer the stage length, the cruise phase will represent a greater proportion of the total block-to-block time, and consequently fuel unit cost will be lower. Furthermore, given that in subsonic aviation the maximum speed is limited by the sound barrier, the longer the sector, the greater the average speed, since the taxiing, take-off, ascent, descent, approach and landing phases, where the speed is significantly lower, will represent a smaller part of the total flight time, resulting in an increase in the productivity of the aircraft. Also, airport or ground handling charges do not increase proportionally to the distance flown, but are usually constant, or almost constant, for a certain type of aircraft, so their impact is distributed over a larger volume of production, in a similar way to what happens with fixed costs.
Finally, and given that it is common for longer flights to be operated with larger aircraft, there is a multiplying effect between them, making the relationship between the cost per ASK and sector length to be an exponentially decreasing curve, as can be seen in Figure 3.9, also taken from the CAPA report mentioned at the beginning of the chapter. Here we can see the so-called adjustment curve, which would determine for each stage length the average unit cost, so that if you are above that curve you would have higher unit costs than the average, and vice versa. This adjustment has been referenced in the comparison between the unit costs of Emirates, IAG and Virgin Atlantic.
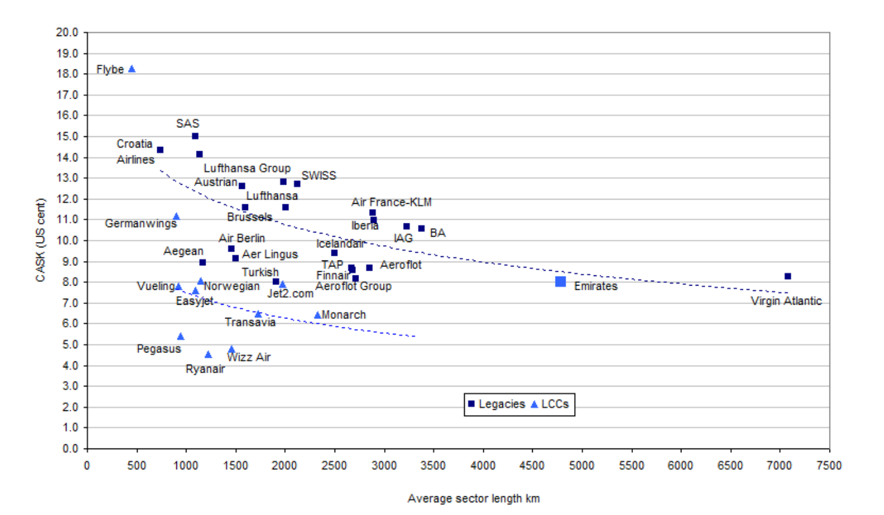
Figure 3.9: cost per ASK vs stage length for different airlines (CAPA, 2014)
Figure 3.9 shows that instead of a single adjustment curve, there are two: the first, higher, would be the one corresponding to network or traditional airlines; while the second, lower, would correspond to the low cost business model. Here the doubt may arise as to why, on the one hand, there are two different curves. And, above all, given that the average aircraft size is larger for network airlines than for low cost carriers, which according to what we have just seen should a priori imply for the former to have lower unit costs, why the figure is showing exactly the opposite. The answer to this supposed paradox comes from the fact that we are comparing two different realities, both in terms of the product and the corresponding operations. The low cost model, by placing a special emphasis on the efficiency and productivity of resources, obtains a structural cost advantage compared to the network model, as reflected in the graph. In the following section we will elaborate on the rational behind this apparent paradox.
As we have seen in Chapter 2, despite the fact that the precursor of the low cost model was the Californian PSA, the pioneer in developing it in a sustained way after the US deregulation was Southwest. This airline has achieved uninterrupted profitability since 1973, something certainly unique in an industry characterized precisely by the opposite, as we have seen in detail in the first chapter. This is why the Southwest model has been extensively studied ever since, to the point that both easyJet and Ryanair have acknowledged publicly that they simply copied it, adapting it to their particular business circumstances and realities. In this section we will look further into the detail of what characterizes the so-called “pure” low cost business model. This sets the basic reference on which all low cost airlines have been based on, adopting many of those characteristics, but also giving up on others, depending on the strategic direction chosen by each company. In fact, not even Southwest has faithfully followed this “pure” model, consciously deviating from it in matters such as selling through travel agencies, offering a small free snack on board, or providing free baggage check-in, to give just a few examples.
The philosophy of the model is based on simplicity, in terms of both the product and operations; below we will see how this simplicity is key to achieving optimal operational efficiency. And it is this efficiency that makes it possible to obtain lower unit costs, which in turn make it possible to offer consumers significantly lower prices than those offered before the existence of the low cost model. What makes these low fares unique is that, in addition to enabling the capture of demand that previously flew with the incumbent airlines, they have fundamentally generated a new demand on their own that did not exist before. This new demand generation is one of the main pillars of the model, as it provides the additional volume that contributes to further improving operational efficiency, which creates a sort of virtuous circle that feeds the entire system back.
Of course this virtuous circle of simplicity → operational efficiency → low costs → low fares generation of additional demand → greater operational efficiency → even lower costs → ... comes with its challenges, which low cost carriers are not strangers to. On one hand, the scale itself makes it very difficult as the company grows to maintain some of the operational parameters on which the model is based. But, above all, the evolution of market and consumer expectations has meant that there has been no choice but to complicate the model in order to adapt to these. This market-forced adjustment has obliged low cost airlines to partially give up on the aforementioned simplicity, virtually evolving towards a hybrid model which we has been previously mentioned, and which we will deal with in more detail in Chapter 5.
Let us then see what the characteristics of the “pure” model are, distinguishing between those that refer to the simplicity of the product, and those that allude to that of the operations. A clarification as to the aforementioned simplicity, and that is that this must be understood in relation to the practices that were customary on the part of traditional airlines when the model was created, some of which have been abandoned today, as these companies have also evolved into a hybrid model. In this way, younger readers run the risk of underestimating the degree of radical innovation that some of the features we are going to explain below introduced, as they are common practice nowadays. To prevent this from happening, we will describe within each what the prevailing industry practices were, to which the model offered an innovative alternative.
• One-way, single price, with no restrictions attached, in contrast to the myriad of fares any travel agent was confronted with when requesting prices for a given route. Depending on whether it was a round-trip or one-way, the time that passed between the outward and the return legs, how far in advance to the flight date the ticket was sold, plus a countless number of additional restrictions and conditions, they all made the act of buying a ticket a very complex operation, for which the intervention of an expert was necessary, a role played by the agency.
• Non-refundable tickets, although refunds or changes were allowed – with an additional charge –, as opposed to the unlimited eligibility for refunds and ticket changes that used to be included within most fares of the traditional airlines. This added great uncertainty to seat inventory optimization, since it caused that even though many seats sold finally flew empty, they could not be sold to other potential customers, which became the origin of the famous overbooking process.
• Dynamic pricing, the earlier the ticket was purchased, the lower the fares, and prices adjusted according to the evolution of bookings, in contrast to the rigid fare structure that existed until then. We will study these dynamic pricing systems in more detail in Chapter 5, but in summary what they are looking for is to sell each seat at the highest price that consumers are willing to pay at any given time.
• Basic fare only covering the seat, with extras separately paid for, offering choice to consumers to pay only for what they needed and valued. To start with, baggage fees to check luggage in was one of the elements that most changed the industry, to the point of radically changing the way many passengers travelled: most of them moved to carry it as hand luggage instead – which, on the other hand, has caused one of the great operational headaches of airlines, as there is not enough space in the overhead lockers for them. By comparison to this, traditional airlines used to offer an all-inclusive fare though much more expensive. This unbundling practice of the “pure” model, initially based on simplicity and the principle of “pay-per-use”, quickly evolved towards the field of ancillary revenue generation, which as we shall see at the end of this chapter represents a significant percentage of the total revenue of many low cost airlines.
• Direct distribution, first by telephone, and then via the Internet, which not only saved agency commission and incentives costs, but also facilitated the establishment of a direct relationship between the consumer and the airline, without intermediaries.
• Electronic tickets, which replaced the paper tickets, which older readers will remember as those small booklets, with multiple carbon-copy sheets for different airline internal administration and control processes, all completely unrelated to the interests and needs of consumers. Although today it is standard practice in almost all airlines, many still remember the anxiety suffered by the first passengers that had to go to the check-in counter without their physical ticket, which was replaced by a mere alphanumeric code and the promise that, after sharing it with the agent, they would be checked in on the flight and their boarding passes would be issued – something that, except for one-off mistakes, was always the case.
• Single class on board, instead of the two classes – sometimes even three – that existed in traditional airlines, with their corresponding physical separation barriers and greater seating space, reducing the use of available space and flexibility, and increasing cabin crew requirements.
• Unallocated seating, initially motivated by the need for simplicity in the reservation and check-in systems, but also because it made the boarding and disembarkation processes – especially the former – more agile, facilitating a quick turnaround of the aircraft at the airport.
• In-flight catering not free of charge, replacing the ubiquitous tetra Brik orange juice and peanuts, which used to be the “free” snack offered in economy class on board short-haul flights – this writer can attest from his early experiences as a passenger. This, which entailed a significant additional cost, both in the product itself and, above all, in the logistics and operational processes necessary to be able to supply it on board, has yet to be demonstrated that it had any significant improvement in consumer perception – especially if the extra money that was being paid to enjoy this feature would be added to the equation.
• Single aircraft type, which simplified and reduced crew and maintenance costs, thanks to commonalities in training and operation processes, as well as in spare parts and maintenance tools. This allowed for significant flexibility and economies of scale as the fleet grew in size. This contrasted with the multiple aircraft types, configurations and manufacturers that usually coexisted in traditional airlines’ fleet. This was an undesired outcome of their history as “flag airlines”, when managerial decisions were not always based on economic rationality, fleet acquisition policies being one of the clearest examples of this.
• Modern, efficient fleet, which reduced its maintenance and fuel costs, as well as emissions. It is common for low cost airlines to have an average fleet age of about four or five years, compared with more than ten years for traditional airlines.
• Point-to-point flights, without connections or code sharing, greatly simplifying the sales and check-in processes, and avoiding the complexity of transfer operations, both for luggage and passengers, at the connecting airport. In addition, the revenue dilution that traditional airlines faced when establishing fares for multi-sector flights was avoided.
• Short- and medium-haul flights, with average stage length of around 1,000 kilometers, although this could vary from airline to airline. Short flights made it easier to optimize crew productivity by allowing several sectors a day with the same crew, improving operational efficiency.
• Operation at secondary airports, which allowed for lower airport charges as they were usually cheaper than the main airports, mostly used by traditional airlines. In addition, as they were not subject to economic regulation, many of the airport operators were free to negotiate bilateral agreements with the airlines, including discounts in exchange for additional traffic, which fit very well with the high volume strategy of low cost airlines.
• Short turnarounds, which used to be between 25 and 30 minutes, and helped maximize the aircraft daily utilization ratio. Although operationally it is a challenge to achieve these times consistently, especially considering the very high load factors, the operation at secondary airports helped to achieve this. Another element supporting this feature was the simplification of the operating procedures to be carried out at turnarounds, without undermining safety. This allowed low cost airlines to achieve utilization ratios of the order of 11 or 12 block hours a day. This was significantly higher than the ratios the traditional carriers obtained from their short- and medium-haul fleets, due to the need for longer turnaround times in order to facilitate and maximize the connections of the hub operation.
The description of the fundamentals of the model is completed when we add an essential element to this philosophy of simplicity, both of the product and of operations. This key element is the relentless focus on optimizing the efficiency and productivity of resources, the true bedrock on which the model is based, as its virtue lies in its ability to reinforce most of the features seen so far.
• High seat density, multiplying the production capability of each aircraft, with the subsequent decrease in the cost per ASK, thanks to the effect we have previously explained. The key was that, due to the existence of a single class on board, as well as the fact that in most cases aircraft were purchased new and with a customized configuration for the airline in question, this increase in seat density on board was achieved without compromising passenger comfort. For example, easyJet accommodates 186 seats in its A320s, 15% more than any of its traditional competitors for the same aircraft, yet still manages to offer about two centimeters more seating space, an effect that is reinforced by the use of ultra-light and, therefore, thinner seats.
• High aircraft utilization, operating an average of between 11 and 12 block hours per day, as previously mentioned. This was achieved by starting to fly as early as it was commercially feasible, and ending the day as late as commercially possible, helped by the short turnarounds at the airports explained above. The combination of this characteristic with the high seat density meant the production capability of each aircraft was considerably greater than that of traditional airlines for the same aircraft, reinforcing the cost advantage, as all fixed costs were shared between more ASK. In addition to this, the higher daily utilization had also a positive impact on crew productivity, contributing to the reduction of unit cost.
• High load factor, around 90% on average throughout the year, which together with the above two characteristics maximized the number of passengers flown per aircraft per day. This is one of the key elements of the dynamic pricing system that we will see in Chapter 5, allowing for all costs to be covered and still generate a profit, despite tickets start selling at very low prices. In addition to this, given that most cost items do not vary significantly with the increase in load factor, the cost per passenger is significantly lower. Finally, in an environment where certain resources such as some airports and airspace are congested, the efficiency in the use of these scarce resources is improved.
• Competitive and efficient crew remuneration systems, which combined a pay structure with an important variable component, driven by the sectors and/or flight hours operated, with a schedule and rostering design aimed at maximizing productivity and flexibility. In addition, cabin crew received commissions on their sales on board, so without a significant gap in terms of total remuneration compared with the crew of traditional airlines, unit cost is lower due to greater efficiency and productivity. This is reinforced by the policy of rostering the minimum number of crew as required by safety regulations, as opposed to the traditional airlines, which added a few more, in order to offer a more personalized service to their premium passengers.
• Minimal station costs, where most of the airport operational processes were subcontracted to third parties, and others were even discontinued. One example of the latter is third-party aircraft cleaning at each turnaround, which was replaced by cabin crew taking care of garbage collection during the final phase of each flight, and carrying out a quick cabin tidy up during the short turnaround at the airport. In contrast to this, traditional airlines used to have their own staff at most airports, even those with a small number of flights, performing different administrative, operational and supervisory functions. This significantly increased costs and complexity, since staff costs were supplemented by the need for an administrative and legal structure, office space, as well as other elements that varied greatly from country to country. Another important feature was related to network design, under which aircraft and crew almost always started and ended the day at their base airport. This in turn reduced the need to overnight outside of the home base, which not only reduced complexity and increased crew flexibility and productivity, but also avoided the high accommodation and subsistence costs that were very common in all traditional airlines during their frequent overnights.
• Minimal overheads, replicating at general level what happened at each airport. Indeed, in contrast to the large organizational structures that characterized traditional airlines, inherited in many cases from the times when they were state-owned “flag airlines” (many authors refer to them as legacy carriers precisely due to that heavy heritage that many carry with them), low cost carriers structures were much flatter and more efficient. They were focused on covering the key business processes, and subcontracting or directly eliminating the rest of non-critical functions. This efficiency and flexibility was also applied to the headquarters, being common that they were very functional and spartan, with open-space distribution. Therefore, individual offices were not needed, significantly reducing office space requirements and, consequently, rental and maintenance costs. Remuneration structures also tended to have an important performance-related variable component. This, in addition to modulating management and administration staff costs to follow the general evolution of the company, helped to create a more aligned, result-focused, corporate culture.
In Table 3.10 we can see a summary of the different characteristics here exposed of the “pure” low cost model, as opposed to that of traditional airlines. At this point we need to remind again that both cases are generalizations done for didactic reasons, since nowadays it is habitual for airlines to have adopted characteristics of the alternative model, evolving towards the previously mentioned hybrid model. What is most relevant is that these characteristics have allowed low cost carriers to achieve a very significant structural cost advantage over traditional airlines, which is what explains the existence of two differentiated unit cost curves in Figure 3.9. We will attempt to quantify the degree of this advantage in the next section.
|
"PURE" MODEL |
TRADITIONAL MODEL |
SIMPLE PRODUCT |
||
One-way, single price, with no restrictions attached |
Complex fare structure, with many restrictions attached |
|
Non-refundable tickets |
Refundable tickets |
|
Dynamic pricing |
Rigid fare structure |
|
Basic fare only covering the seat, with extras separately paid for |
Everything included |
|
Direct distribution |
Indirect distribution |
|
Electronic tickets |
Paper ticket |
|
Single class on board |
Multiple classes on board |
|
Unallocated seating |
Allocated seating |
|
In-flight catering not free of charge |
Free catering |
|
SIMPLE OPERATIONS |
Single aircraft type |
Multiple aircraft types |
Modern, efficient fleet |
Older, less efficient fleet |
|
Point-to-point flights |
Connecting flights |
|
Short- and medium-haul flights |
Short-, medium- and long-haul flights |
|
Operation at secondary airports |
Operation at main airports |
|
Short turnarounds |
Long turnarounds |
|
EFFICIENCY AND PRODUCTITIVY OF RESOURCES |
High seat density |
Medium/low seat density |
High aircraft utilization |
Medium/low aircraft utilization |
|
High load factor |
Medium/low load factor |
|
Competitive and efficient crew remuneration systems |
Complex and rigid crew remuneration systems |
|
Minimal station costs |
High station costs |
|
Minimal overheads |
High overheads |
Table 3.10: characteristics of the “pure” business model versus traditional model
There are several studies seeking to quantify the structural cost advantage obtained by the “pure” low cost model over the traditional carriers, a task that brings a few challenges with it. The first is that, in order to make a proper comparison, traditional airlines cost structure should be broken down between long-haul on the one hand, and short- and medium-haul on the other. Obtaining details of this segregation, which would allow us to focus just on the latter, is not always easy. Secondly, the heterogeneity existing among low cost carriers when it comes to the different degree of fidelity in following the “pure” model, is an even bigger problem for traditional airlines. Here there is still a much bigger disparity in criteria, approaches and models, making the comparison harder. Because of all this, more than a specific number, we will just be looking for orders of magnitude in the form of ranges, as we will see below.
Beyond the methodological challenges outlined above, there is considerable consensus about the order of magnitude of the unit cost difference between the two models being around 50% to 60%. This is very significant and explains the reason for the two differentiated curves in Figure 3.9. When trying to understand the foundations on which this difference is based, new challenges arise due to the different accounting criteria existing between companies, as well as the difficulty of referencing the cost accounting elements of these with the fundamentals of the model we have just studied. Some authors (Doganis, 2006 / Lobbenberg, 2003 / Bouwer et al., 2017) have used a cascade model, such as the one shown in Figure 3.11, in which we can visualize the contribution that each of the characteristics included in Table 3.10 brings to this structural cost advantage.
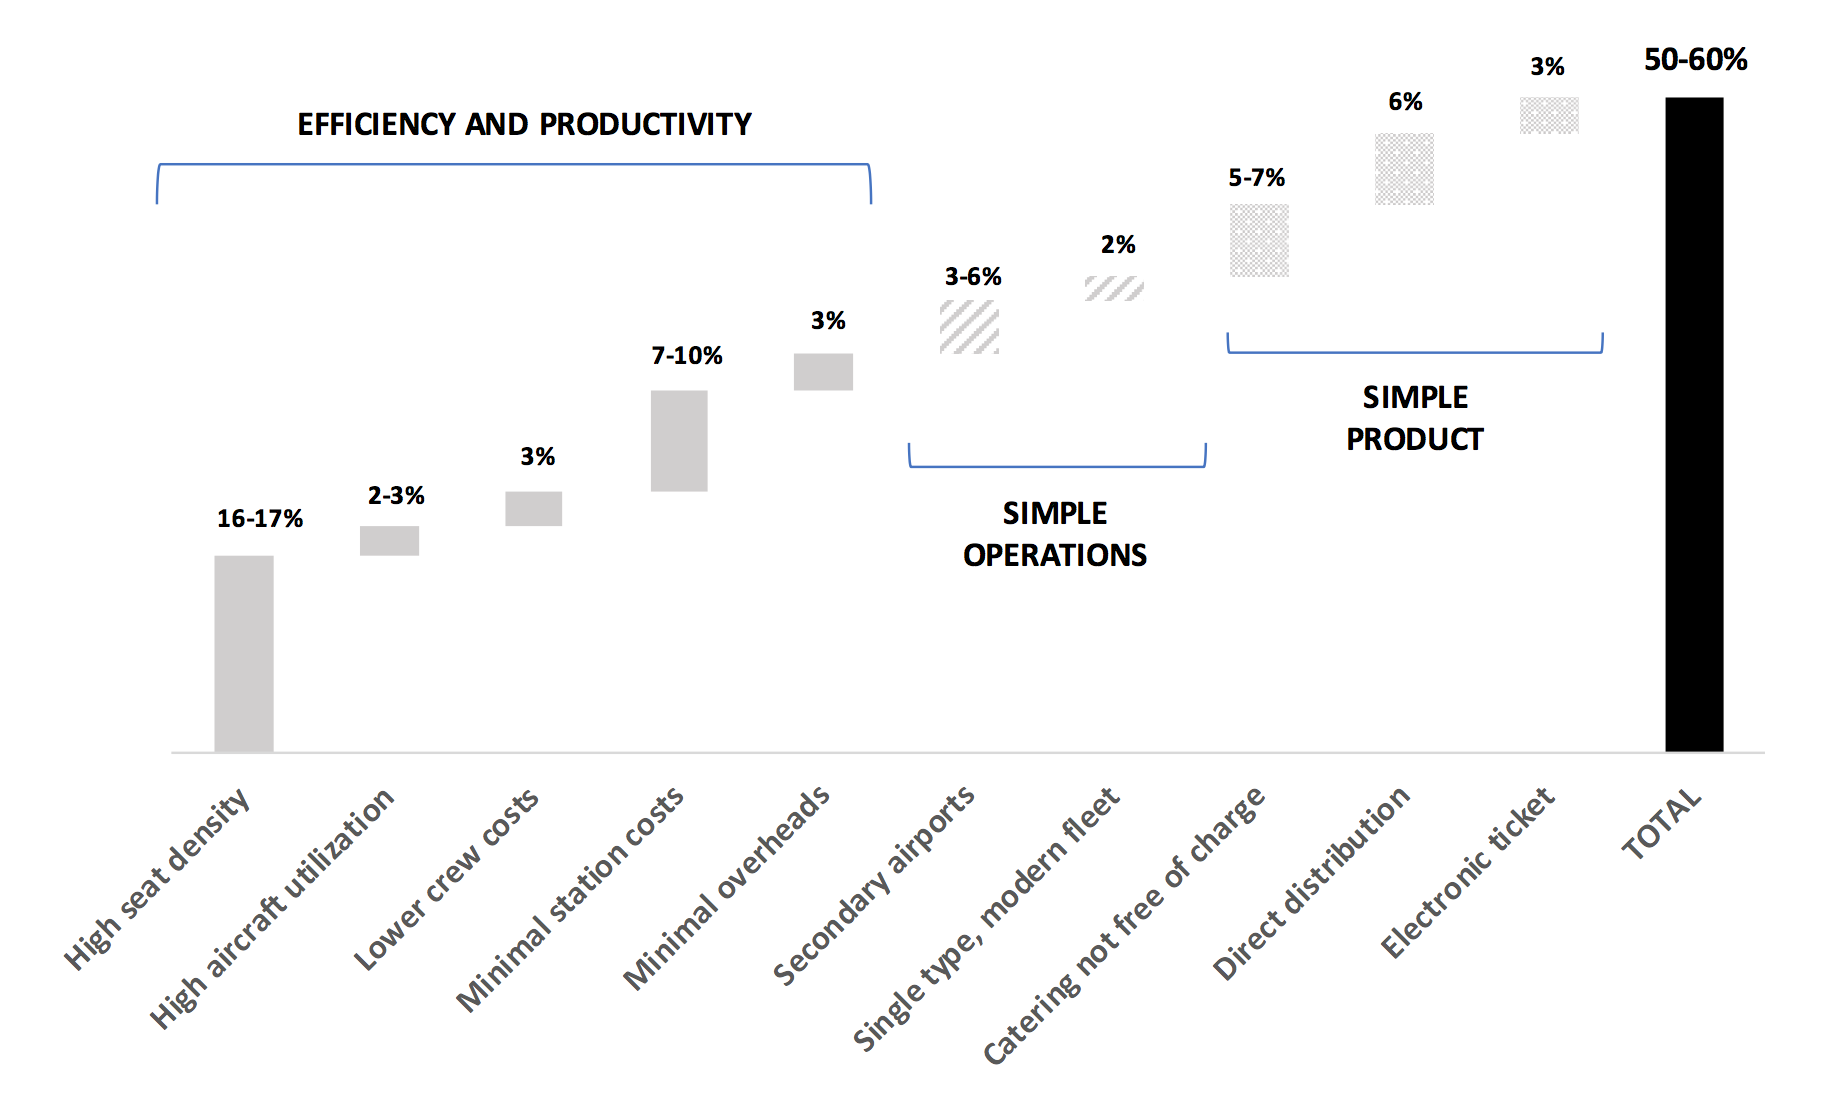
Figure 3.11: unit cost advantage of the “pure” versus the traditional model
In order to try to better understand the fundamentals of the model that enable this cost advantage to happen, we will again use the structure described in the previous section, based on the simplicity both of the product and of the operations, underpinned by the foundations formed by the efficiency and productivity of resources. A quick glance at Figure 3.11 already shows that the latter represents more than half of the structural cost advantage, which contrasts with the preconceived idea that it is the elements of simplicity that contribute the most to the unit cost reduction, giving rise to an infinite number of clichés. On the other hand, the more observant reader will have realized that not all the characteristics exposed in the previous section are in this figure. This is because some of them, instead of directly contributing to the reduction in costs, have a catalyst role that contributes to reinforcing and enabling the rest of the characteristics that are included, as we will see at the end of this section.
The following is a brief description of how each of the three categories into which the model’s fundamentals have been structured contributes to the cost advantage. We will reverse its order over that shown above, in order to start with the one that have the biggest impact over that advantage in the first place.
• EFFICIENCY AND PRODUCTIVITY OF RESOURCES
According to the analysis shown, this represents between 31% and 36% cost reduction compared to the traditional model, with high seat density being its main driver, responsible for at least half of this difference. The reason for the great relevance of this feature is that, in addition to the positive effects on the relative cost that we have already mentioned, it contributes positively to practically every single cost item, even those in which a priori there is no advantage between the two models, such as fuel or navigation fees. The next characteristic in order of relevance is that of station costs, which represent between 7% to 10% relative cost advantage, for the reasons explained above. Finally, high aircraft utilization, crew costs and overheads each contribute around 3%, completing the contribution to this key category of efficiency and productivity of resources, often overlooked.
• SIMPLE OPERATIONS
This category represents between 5% and 8% of the relative cost advantage, with the operation in secondary airports as its main characteristic, due to the lower cost of operation than at the main airports. The other important feature in this category is the modern and efficient fleet, coupled with the operation with a single aircraft type, both of which are jointly attributed about 2% of the difference. Although it might be surprising that the other characteristics that contribute to the operational simplicity of the model are not reflected here, this is because some of them, rather than having a direct impact on the cost difference, play the enabling role mentioned above.
• SIMPLE PRODUCT
Between 14% and 16% of the cost difference is due to this category, with paid on board catering and direct distribution being its main contributors, with around 6% each. The electronic ticket closes the analysis, responsible for 3% of the relative cost advantage between the “pure” low cost model and the traditional one.
Although we are running ahead of what we will cover in more detail in Chapter 5, when we will explain in detail how both extremes are trending towards a hybrid model, let’s do now at least a small review of the aforementioned structural advantage sustainability over time. Indeed, today it can be seen that many traditional airlines have fully or partially adopted several of the features of the low cost model, managing to reduce this advantage – we will see later by how much. This is so because some of those features, especially those which refer to product simplicity, are easier to replicate without giving up the fundamentals of the model. Hence, quite a few traditional airlines have adopted characteristics such as charging for on board catering – at least for the cheapest fares –, electronic ticketing, or the increase in direct distribution, amongst others. When we will come to this chapter it will be time to verify that, even within the framework of the homogenization brought forward by the hybrid model, one of the fundamental characteristics that still differentiates both models is the focus on point-to-point flights, as opposed to connecting flights. This will make us propose the terms point-to-point airline versus network airline, instead of the hitherto used low cost versus traditional.
Returning to the cost advantages, we would need to analyze now the rest of the characteristics that play an enabling role on these advantages, instead of having a direct contribution, which we will do next.
• One-way, single price, with no restrictions attached, which is a basic catalyst for developing direct distribution through simplifying the booking process, thus allowing automation and self-service.
• Single class on board, which facilitates the high seat density, and also the reduction of cabin crew requirements to what is strictly necessary for safety regulation purposes.
• Unallocated seating, which contributes to increasing aircraft utilization by facilitating short turnarounds of 25-30 minutes, thanks to a swifter boarding process, especially when embarking through both front and rear aircraft doors.
• Point-to-point flights, which also facilitates the increase in utilization by allowing for short turnarounds, without the need to add time to them to facilitate connections. In addition, station costs are reduced as there is no need for staff and operational processes to manage the connection of transit passengers and, above all, their luggage.
• Short- and medium-haul flights, which helps to improve crew productivity by reducing their unit cost; they also allow for a network design in which the vast majority of aircraft and crews sleep at their base cities, reducing accommodation and maintenance costs involved in out-of-base overnight stays.
• Short turnarounds, allowing to obtain aircraft utilization of between 11 and 12 block hours per day, characteristic of the model.
Finally, the aforementioned observant reader will have noticed that we have not yet covered all of the characteristics listed in Table 3.10, which might give rise to the impression that the remaining ones do not fulfill any main function in defining the fundamentals of the model, and have been included just for the fun of it. Nothing could be further from the truth: the reason they have not been covered so far is that their role is not to create or reinforce the structural cost advantage, but to play a key role in creating another advantage, often overlooked, even though in many cases it is even more important than the former. This is none other than the revenue advantage that the low cost model has achieved over the traditional one, with whose analysis we will close this chapter.
Although Chapter 5 is where we will develop the question of the key role that sound commercial management plays in the success of the low cost business model, in order to close this analysis of its fundamentals we need to briefly talk about the revenue advantages enabled by some of its characteristics in contrast with the traditional one. These are the following, allowing us to, at last, fully complete all those listed in Table 3.10:
• Non-refundable tickets
• Dynamic pricing
• Basic fare only covering the seat, the rest being optional
• High load factor
At first glance it can be seen that, with the exception of the last feature, the other three are all part of the product simplicity category, and they reinforce each other, so that they enable the following revenue advantages compared to the traditional model:
• Strong cash generation, because the dynamic pricing system encourages tickets to be purchased well in advance of the flight date, as this is when the cheapest fares are available. This characteristic, together with direct distribution, which implies that sales are paid almost in cash – mostly via credit card –, leads to significant positive cash flows, a fundamental advantage in an industry where, as we have seen, cash is king. In contrast with this, traditional airlines often need a long time to receive payment for all their sales, since a large part of them are subject to complex and lengthy settlement processes with travel agencies, and with other airlines in the case of interline tickets.
• Ancillary revenue generation, which is facilitated by the feature that the basic fare only covers the price of the seat, with the rest of the services being optional in exchange for an additional charge. Thus, something that started with the collection of a surcharge for passengers who wanted to check their baggage in, has expanded and got to such a level of sophistication that ancillary revenue nowadays represents about 20% of the total revenue of a low cost airline. This is because, in addition to selling in the same booking process additional related services – such as hotels, travel insurance or rental cars –, some of the characteristics of the model initially contributing to the cost structural advantage have now turned into an ancillary revenue opportunity. Examples of this are the paid on board catering or unallocated seating, which have made it possible to generate significant profits by selling drinks and food on board, or by creating products such as the payment of an additional charge for the opportunity to board the aircraft first and choose the most suitable seat, respectively. The all-inclusive model of the traditional airlines, now largely abandoned, meant that they did not enjoy this possibility.
• Additional demand generation, leveraging its elasticity through dynamic pricing, which allows for tickets sold well in advance to be bought at prices completely unthinkable before the existence of low cost airlines. A key feature to facilitate this is the non-refundability of those tickets, as otherwise the model would be broken, something we will explain later. In addition, the very sophisticated revenue management systems allow prices to adapt according to demand, in such a way as to achieve the characteristic high load factors of the model. This in turn allows for marginal cost pricing to be offered for early bookings, and even if those fares are not yet covering all the fixed costs, it is still possible to make a profit. This is a key issue, given that one of the main risks is the possible dilution of the significant cost advantage achieved thanks to the bigger production capability from the model – let us remember here that high seating density and aircraft utilization are jointly responsible for around 20% of the relative cost reduction – on the revenue side, by not being able to sell many of those seats at an adequate price.
We have completed the description and analysis of the fundamentals of the low cost business model, and having come this far, it would not be strange for any reader familiar with the history of commercial aviation to think that many of the features and benefits discussed throughout this chapter are not new, or even exclusive to this model. Indeed, the charter or non-scheduled model successfully developed quite a few of these elements during the 1960s and 1970s, especially in Europe, to the point that some speak of the charter as the true precursor of the low cost model. This circumstance justifies the fact that we dedicate the following chapter to study this model, and to be able to verify that this has “almost” been the case, although not completely.
